 Display GraphMe in browsers
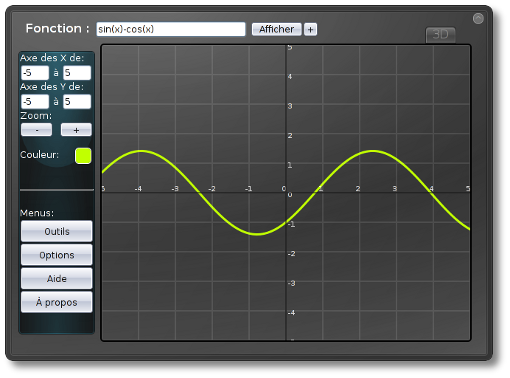
GraphMe is a app that is developed using html, javascript and css. It can be used for drawing graphs. This document must explain how to use GraphMe. This app have a different functions and some useful advices for users.
This widget can be downloaded from the Internet in a packed format. Before using it must be unpacked. GraphMe was developed for using in web-browsers and integration in Sankore. To add this app in Sankore you should copy folder named "GraphMe.wgt" in "../library/interactive/". For example, on "windows OS" GraphMe must be in folder with following path: "C: / Program Files / Sankore 4/library/interactive/GraphMe.wgt". If you have no Sankore then you can get it on http://getuniboard.com/.
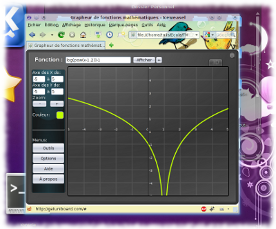
Display GraphMe in browsersA) To display this app in browser just enough to open the file named "Grapheur.xhtml" (it's in root folder) with your browser. But some browsers can not display app correctly. Below is the list of browsers that are able to display app:
B) To open widget in Sankore you should first open folder "Application" that is at the left of the screen. Then you must find this app and add it to the page.
 Display GraphMe in Sankore
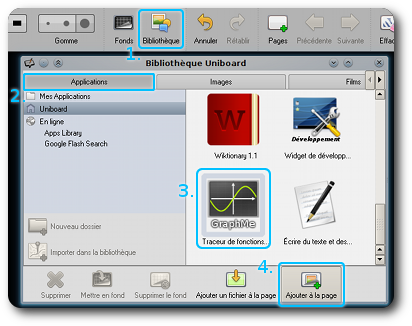
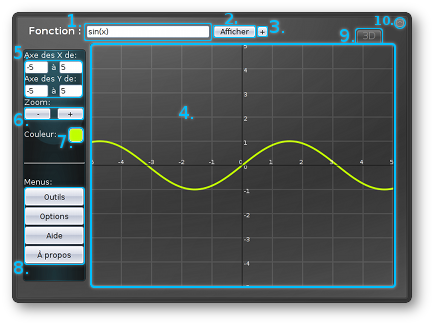
To draw mathematical function just enter it at the top of widget and press button "Display". You can use different functions and predefined constants.
Not always it's easy to understand how to record a required function. Really if anywhere you err then graph will not displayed. Also do not forget about "*" (multiply) to multiply and "." (decimal point) to write point.
The two-dimensional function must be written as y=[...] and the three-dimensional function nust be written as z=[...]. Other examples are available to use in menu "Help" if you have some difficulties with function definition.
Sometimes when you draw the function you don't see all necessary information about this function. In this case you can change position of graph.
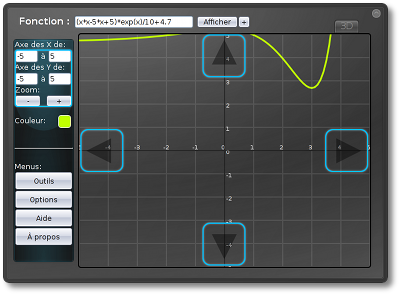
To move the function graph just use a navigation arrows that are in the four edges of the display or mouse move tool (menu Service).
To define place to display you should enter a custom values in the left side of the widget. The left value must be less than the right value. In other case graph will not displayed.
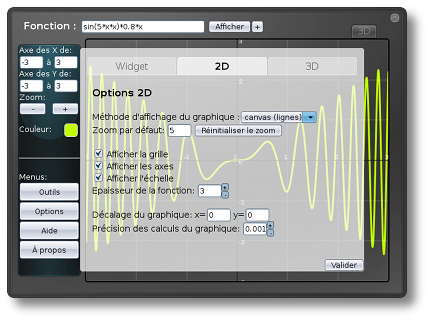
You can increase or decrease the scale of displaying using buttons that are in the left menu. So you'll see more information about function. Zoom can be reset in options.
To open the menu you should click a button "Options" that is in the left of the widget. If you click on this button again then menu will close. There are some buttons for navigation between options. Their short description:
This menu allows you to choose first action of the mouse on the graph. There is a choice of three options:
Then, this menu also allows to calculate a point of the function. Simply enter the coordinate "x" from the point where we want to find the coordinate "y" and press the "Evaluate". For example, if the function is "x * x" and that defined "x = 2", then the point whose coordinate on the X axis is "2" will be to coordinate on the Y axis "4".
Another useful tool is the analysis of function. To analyse the function click on "start the analysis". Analyses based on this widget are not 100% reliable, but are complementary to a analysis of function that you are doing yourself. It may be that this tool will be improved in a future version of the widget.
In this menu there are also tests the display. They can try different methods to display and see if they work on the browser used.
To draw multiple functions simultaneously, click the small "+" button which is located to the right of "View" (point 1). Then, a menu appears.
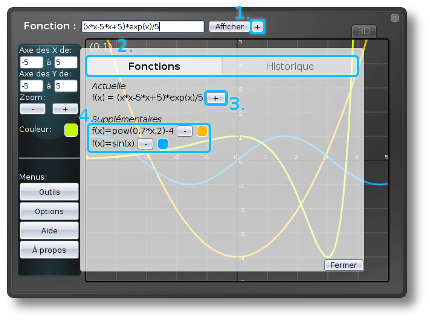
The tabs in this menu can go to the history or the additional features (point 2). To add a function click the button to the right of the current function (point 3). Below is a list that contains all the displayed functions (point 4). To remove a function, just click on the "-" button next to it. It is also possible to change the color of each function separately.
History can review all the functions that have already been drawn. When you click on a function of history current function replaced by the function of history.
"Drawing several functions simultaneously" mode is only possible with the display method "canvas" in two dimensions, but the history can be used with all methods of display.
The latest version of the widget can be downloaded from the following page: http://gyb.educanet2.ch/tm-widgets/.ws_gen/?15. To update GraphMe, you can also click on "Update" in the options menu.
If you want to report a bug, have a suggestion from the widget or just want to ask a question, please contact me by e-mail at: yannick.vessaz@gmail.com.